In our Elliott Wave analysis of the Australian Stock Exchange (ASX) focusing on Woodside Energy Group Ltd (WDS), we observe that wave ((iv))-green is currently unfolding as a Triangle Correction. Within this correction, wave (c)-purple is anticipated to continue its upward movement before the completion of the entire Triangle Correction, after which wave ((v))-green is expected to resume its downward trajectory.
ASX: WDS Elliott Wave Analysis
Wave Function: Major trend (Minute degree, green).
Wave Mode: Motive.
Wave Structure: Impulse.
Wave Position: Wave ((iv))-green.
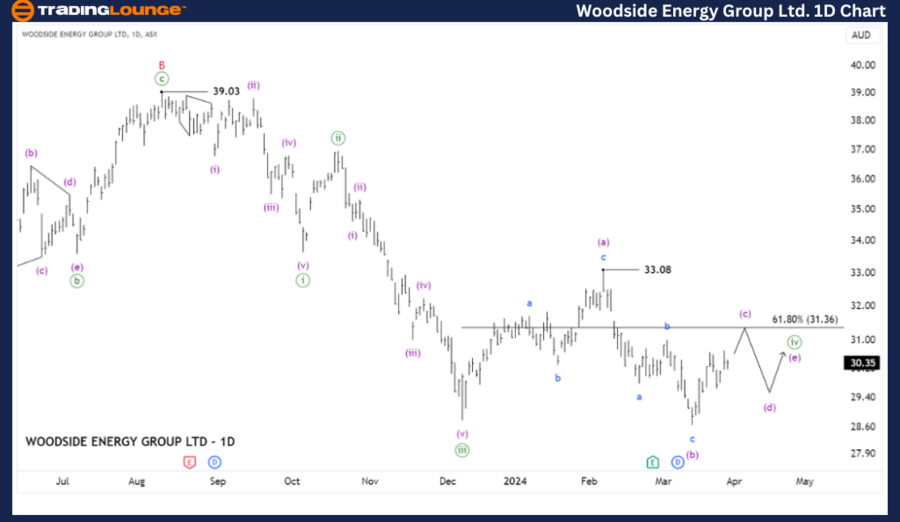
Analysis: The current short-term outlook indicates the initiation of wave ((iv))-green, likely to form a corrective Triangle pattern. Consequently, we anticipate sideways movement in wave ((iv)) before the resumption of downward movement in wave ((v))-green.
Invalidation Point: 33.08
ASX: WDS Elliott Wave Analysis
Wave Function: Counter trend (Minuette degree, purple).
Wave Mode: Corrective.
Wave Structure: Triangle.
Wave Position: Wave (c)-purple.
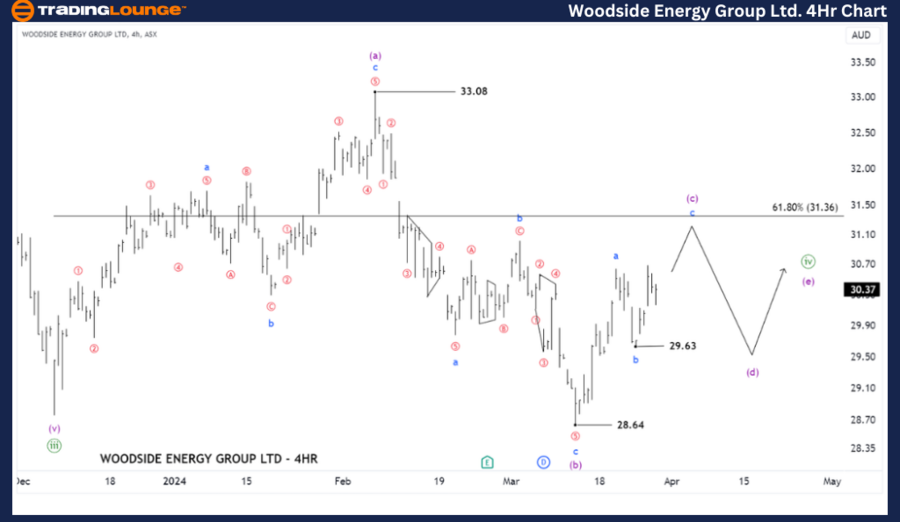
Analysis: In the shorter term, wave ((iv))-green is further detailed as a Triangle Correction, with waves (a) and (b)-purple already completed. Currently, wave (c)-purple is unfolding, and it is expected to rise to test the resistance level around 31.36, a standard retracement ratio compared to wave (a) within a Triangle Correction.
Invalidation Point: 33.08
Conclusion
Our analysis and forecast of ASX: WDS aim to provide readers with insights into current market trends and potential trading opportunities. We offer specific price points for validation or invalidation signals, enhancing confidence in our perspective. By combining these factors, we strive to provide readers with an objective and professional perspective on market trends.