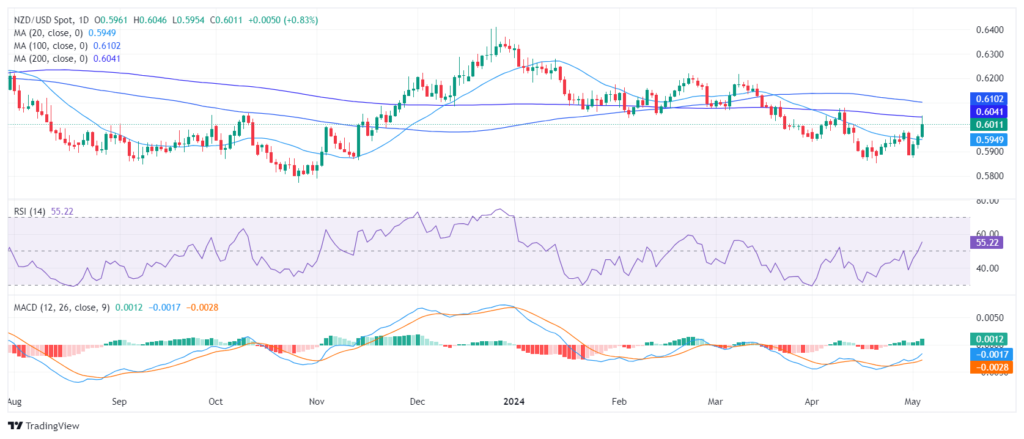
- The daily indicators hint at a strengthening bullish momentum.
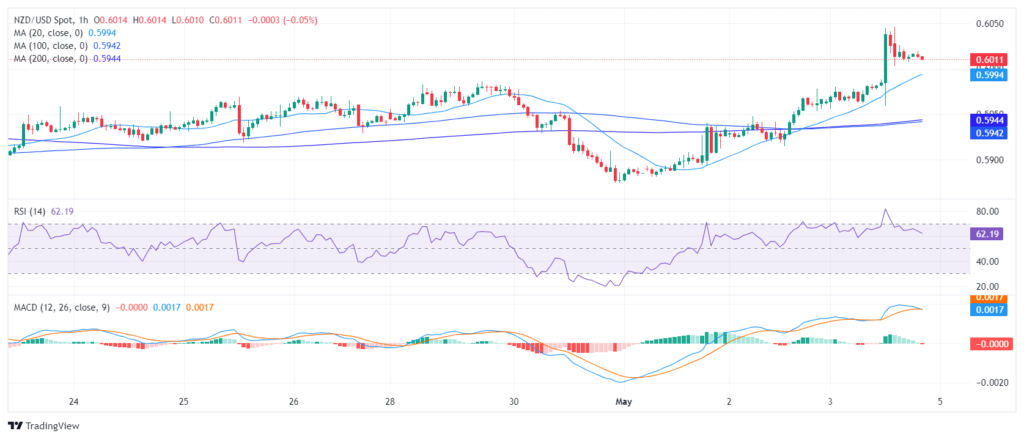
- Hourly indicators are consolidating after hitting overbought conditions earlier in the session.
- If the buyers regain the 100-day SMA, the bearish trend will be threatened.
At the week’s end, the NZD/USD pair rallied to approximately 0.6050, showing a gain of 0.80%. Although bullish momentum is emerging, the general trend still favors sellers. Further bullish confirmation is needed after the pair’s unsuccessful attempt to surpass a critical 100-day Simple Moving Average (SMA) during Friday’s trading session.
On the daily chart, the Relative Strength Index (RSI) indicates a shift toward a stronger bullish trend. In the last session, the RSI recorded 56, placing it in positive territory. This demonstrates a consistent increase in buyer momentum after being below 50 since early April.
NZD/USD Daily Chart
A similar pattern is seen in the hourly chart, where the RSI stands at 62, though it flattened somewhat after surpassing 70 earlier in the session. Additionally, the Moving Average Convergence Divergence (MACD) histogram consistently displayed red bars, indicating a potential slowdown in bullish momentum.
NZD/USD Hourly Chart
In terms of the overall market trend, the NZD/USD is trading below the 100- and 200-day SMAs, indicating significant downside pressure on the pair and posing a challenge for short-term buyers. Notably, the pair encountered resistance around the 100-day SMA at the 0.6100 level during Friday’s session, suggesting that buyers need more momentum to establish a bullish outlook. However, the break above the 20-day SMA has improved the short-term outlook.