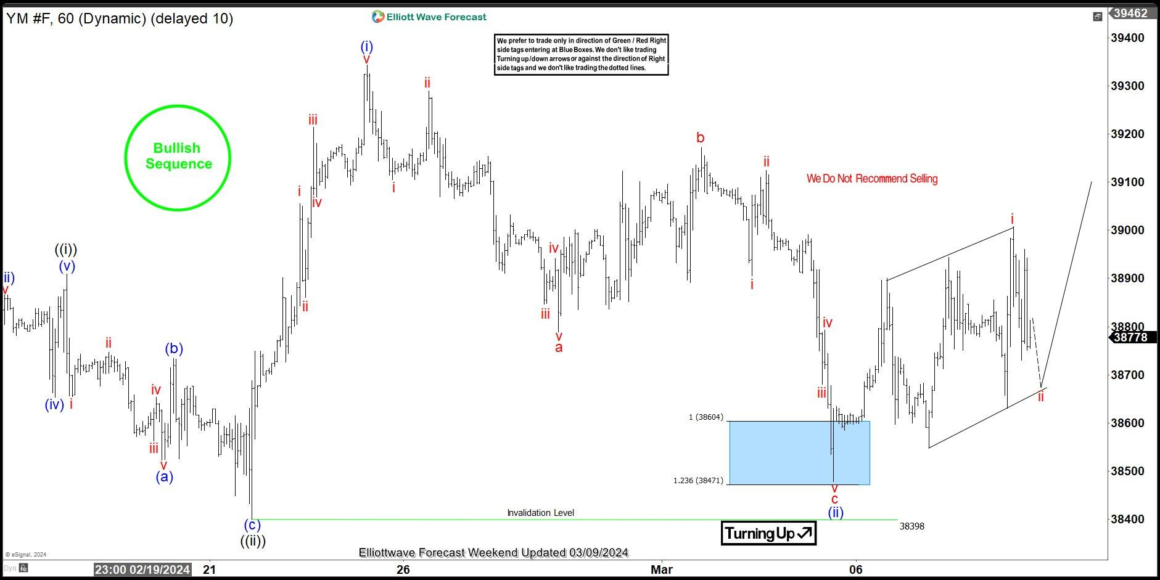
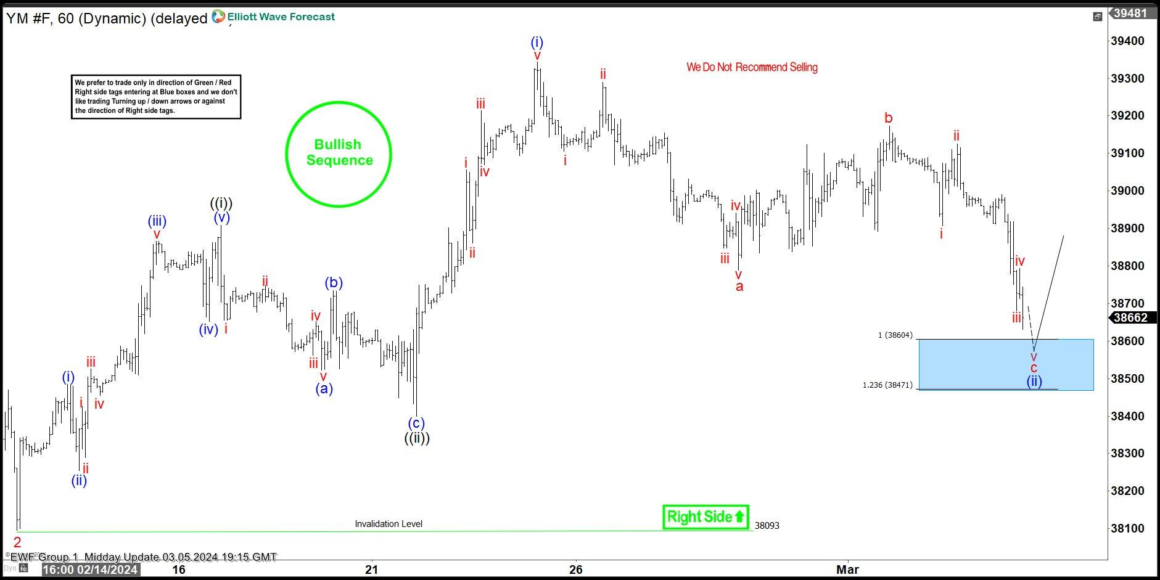
Hey traders! In this article, we’re diving into the Elliott Wave charts of Dow Jones Futures (YM_F) recently published in our members’ area. YM_F experienced a pullback, unfolding as an Elliott Wave Zig Zag pattern. It showed three clear waves down from the February 23rd peak, completing its correction at the Equal Legs zone, marked as the Blue Box or Buying Area. Let’s break down the Elliott Wave pattern and trading setup.
Dow Jones Futures displays a lower low structure from its peak on the one-hour chart, with a correction labeled as a, b, and c. We might still be in the c-red leg, suggesting an incomplete price structure and potential downside toward the buying zone of 38604-38471. We don’t advise selling YM_F and prefer the long side from the Blue Box (buying zone). Once Dow Jones reaches this area, it ideally rallies toward new highs or bounces in three waves. When the bounce hits 50 Fibs against the b red high, we make the long position risk-free (put SL at BE) and take partial profits.
A quick reminder on how to trade our charts: Red bearish stamp + blue box = Selling Setup, Green bullish stamp + blue box = Buying Setup. Charts with Black stamps are not tradable.
As of the one-hour chart on March 9th, Dow Jones extended toward our buying zone as expected. YM_F found buyers at the Blue Box, and we see a positive reaction. Any long positions from the equal legs area should now be risk-free. If the price remains above the 38473 low, we anticipate further strength in Dow Jones, ideally toward new highs.
Remember, the market is dynamic, and the presented view could have changed.