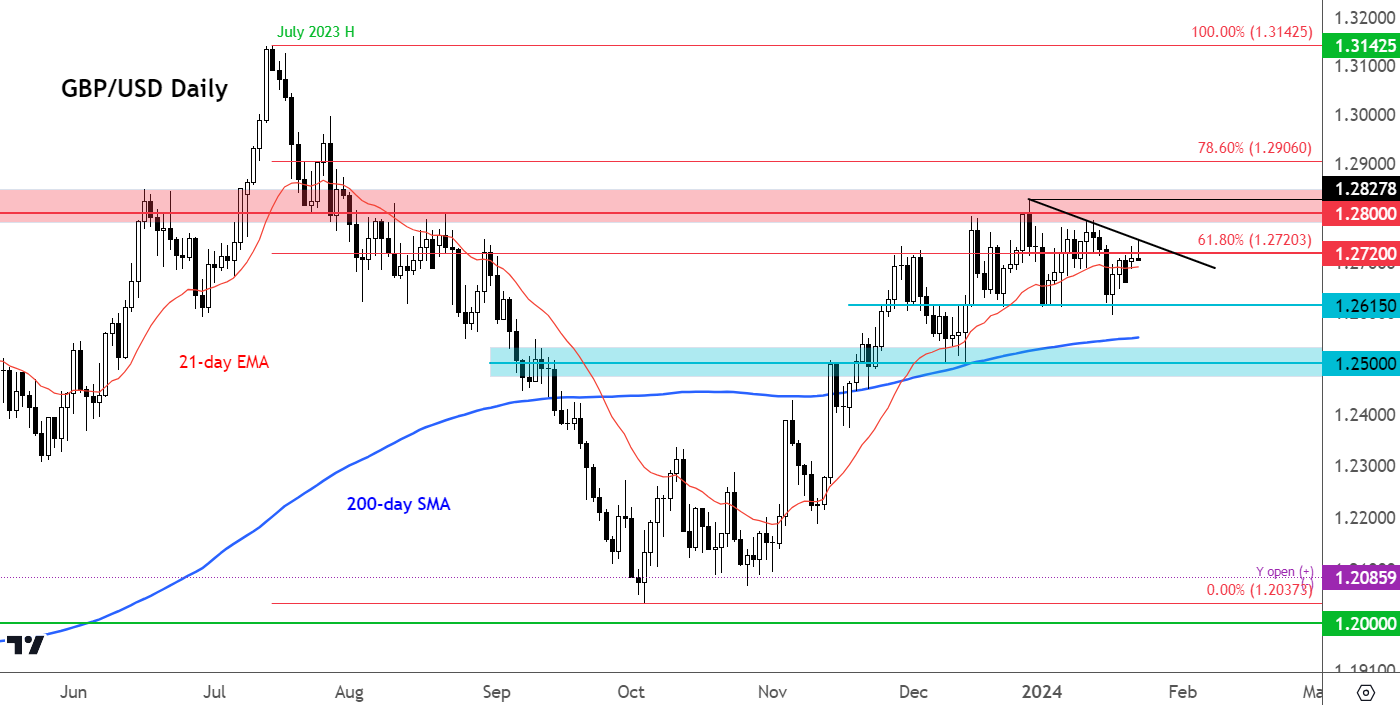
The British Pound (GBP) is an interesting currency to watch in forex in the coming weeks, ahead of the Bank of England rate decision on February 1st. We have Wednesday’s UK PMI data as the only major release ahead of the Bank of England meeting, along with some other second-tier macro data that shouldn’t cause too much volatility for the British pound.
- GBP/USD Analysis: UK PMIs then Bank of England will be the next priority for Sterling traders.
- The US Dollar turns positive this week ahead of PMI, GDP and PCE inflation.
- GBP/USD technical analysis suggests that the bullish momentum has faded.
Last week’s mixed data from the UK put the Bank of England in a difficult position. The data showed that there is significant pressure on consumers, with average incomes lower than expected and CPI higher at an annual rate of 4%. The result of the squeeze on household incomes was a 3.2% drop in monthly retail sales data.
The Bank of England will not want to oppose plans to cut rates too strongly, as this could damage confidence and further strain the economy. Yet with inflation remaining persistent, he will not be able to cut rates as soon as markets want it. There is therefore a risk that the Bank of England will keep rates high for longer, causing further damage to an already struggling economy. Any benefits sterling might gain from the outlook for higher long-term rates could be outweighed by concerns about growth.
So I don’t see how the pound sterling can climb significantly higher without first staging a correction, especially if US data continues to surprise positively.
Speaking of…
US Dollar Turns Positive This Week Ahead of PMI, GDP and PCE Inflation
The US dollar fell overnight as the Japanese yen and Chinese yuan rallied, with the latter boosted by reports that Chinese authorities are considering a package of measures to stabilize the plummeting stock market . However, the Japanese yen was unable to hold on to its Bank of Japan-linked gains as the USD/JPY pair rallied from below 147.00 to climb to 148.00 at the time of writing, after the Bank of Japan maintained its monetary policy and offered very few clues. on a possible normalization of policy in the coming months. As a result, the US Dollar Index (DXY) started to turn positive during the session and is now also positive on the week as it tests key resistance and the 200-day moving average at 103.50 ahead of the key macroeconomic events later in the week.
Investors expected the Fed to cut interest rates sooner than expected. This year, those expectations were pushed back thanks to strong data and hawkish comments from the Fed, and as a result the greenback rose alongside yields. A few weeks ago, everyone thought a March rate cut was a certainty. Now it’s a toss-up, according to the CME’s FedWatch tool.
In addition to the midweek US PMI, we have US GDP on Thursday and the core PCE index on Friday, making it a busy second half of the week for the dollar. Recent strong reports on CPI, employment and retail sales have boosted the US dollar, putting pressure on major currency pairs. If GDP data shows the U.S. economy remains strong, expectations of an imminent interest rate cut will be further pushed back.
GBP/USD analysis: technical levels to watch

The GBP/USD pair has lost its bullish momentum that was prevalent during the last two months of 2023. So far this year, the cable has traded in a very tight range, remaining in negative territory for the ‘essential. The potential for a downward correction increases as the top starts to look heavy.
Since peaking just under 1.2830 in late December, GBP/USD has made a few lower highs and another could be created this week, US data permitting.
There is strong resistance between the 1.2720 and 1.2800 area. The first is related to the 61.8% Fibonacci retracement level from the July decline. A clear break above the 1.2720-1.2800 area is now required to re-establish the uptrend.
Near-term support lies around 1.2680, followed by the area around 1.2600. The 200-day moving average stands at 1.2550.
