In the technical analysis of Netflix (NFLX), the Elliott Wave theory suggests a bullish trend.
Function: The analysis identifies a trending function within the market.
Mode: It indicates an impulsive pattern, suggesting strong directional movement.
Structure: The analysis identifies a motive structure within the Elliott Wave framework.
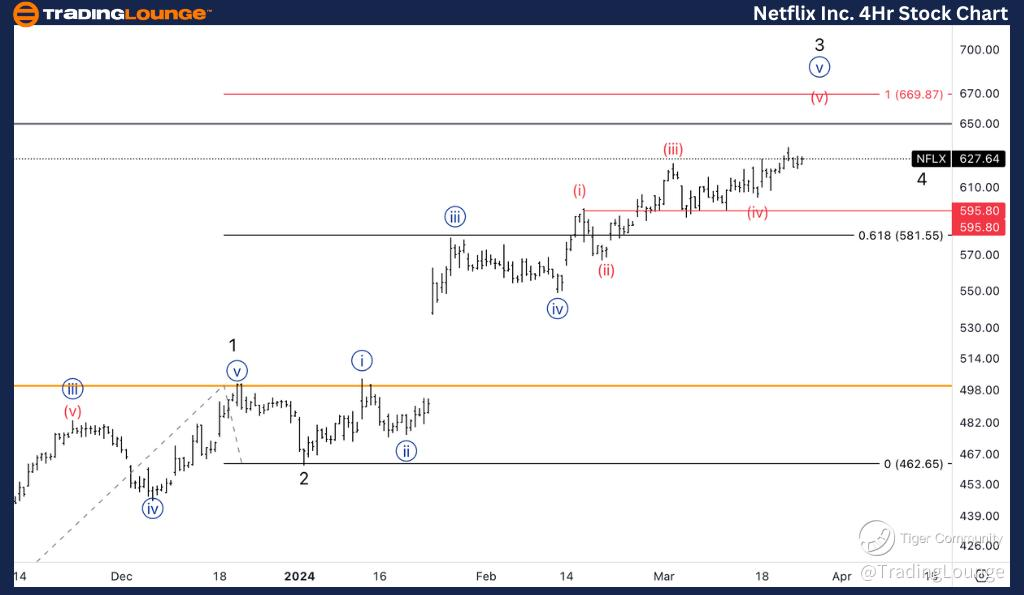
Position: Currently, the focus is on Wave 3 of (3), indicating a significant upward movement.
Direction: The analysis predicts further upside momentum in Wave 3.
Key Levels:
– Medium Level: The analysis anticipates reaching $650, potentially marking the top of Wave 3.
– Equality Level: Parity observed between Wave 3 and Wave 1 at $670, suggesting a possible price target.
On the daily chart, the analysis highlights a motive structure within Wave (v) of {iii}, indicating continued upside momentum.
Direction: Wave (v) suggests further upward movement after a consolidation phase in Wave (iv).
Based on Elliott Wave theory, the analysis provides insights into potential price targets and the overall bullish trend in Netflix’s stock.