- NZD/USD extends gains despite the prevailing bearish sentiment for the pair.
- A break below 0.5900 could lead the pair to test the rebound support level of 0.5863.
- A break into the triangle around the level of 0.5963 has the potential to weaken the bearish sentiment.
The NZD/USD pair has seen upward movement for three consecutive sessions, with its value around 0.5940 during the European session on Wednesday. Currently, it is close to the lower boundary of the daily symmetrical triangle at approximately 0.5963. Crossing into the triangle could mitigate the prevailing bearish outlook.
However, the Moving Average Convergence Divergence (MACD) indicator points to a continuing downward trend, as evidenced by the MACD line’s position below both the centerline and the signal line.
The 14-day Relative Strength Index (RSI) also supports a bearish view, remaining under the 50 mark, which might lead the NZD/USD pair towards the key level of 0.5900. Should it drop below this, it could reach further support near 0.5863 and 0.5850.
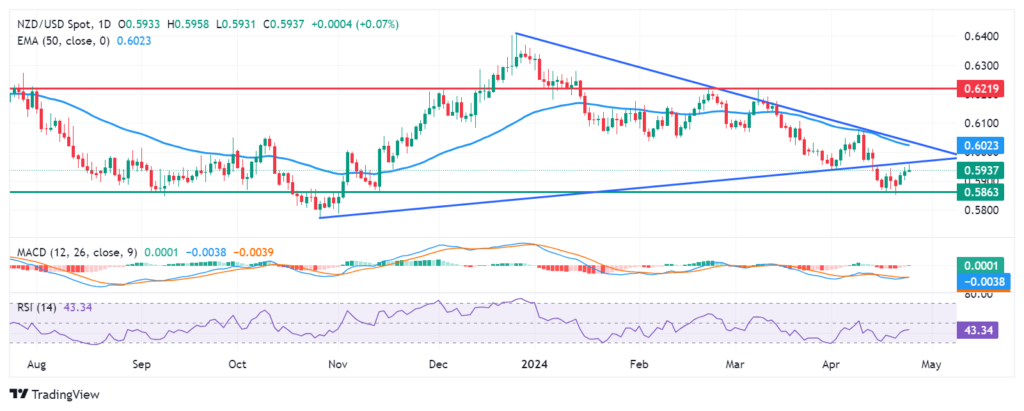
On the other hand, if the NZD/USD pair penetrates the symmetrical triangle, it could aim for the 0.6000 psychological threshold. Surpassing this barrier might propel the pair towards the 50-day Exponential Moving Average (EMA) at 0.6023, coinciding with the triangle’s upper limit near 0.6030.
NZD/USD: Daily Chart