The NZD/USD pair found some support at around 0.5990 during the European session on Wednesday, signalling a potential further downside. Kiwi assets face challenges as the New Zealand economy enters a technical recession, with contractions observed in the last two quarters of 2023.
The Reserve Bank of New Zealand (RBNZ) is navigating between high inflation and a bleak economic outlook, maintaining the Official Cash Rate (OCR) at 5.5% to tackle inflationary pressures. However, this affects economic activities, reducing investment and consumer spending.
Global markets witness volatility as uncertainty looms ahead of the release of the United States’ core Personal Consumption Expenditure Price Index (PCE) data for February. S&P 500 futures show significant gains in the London session.
The US Dollar Index (DXY) inches closer to a monthly high of 104.50, while 10-year US Treasury yields remain steady at 4.23%.
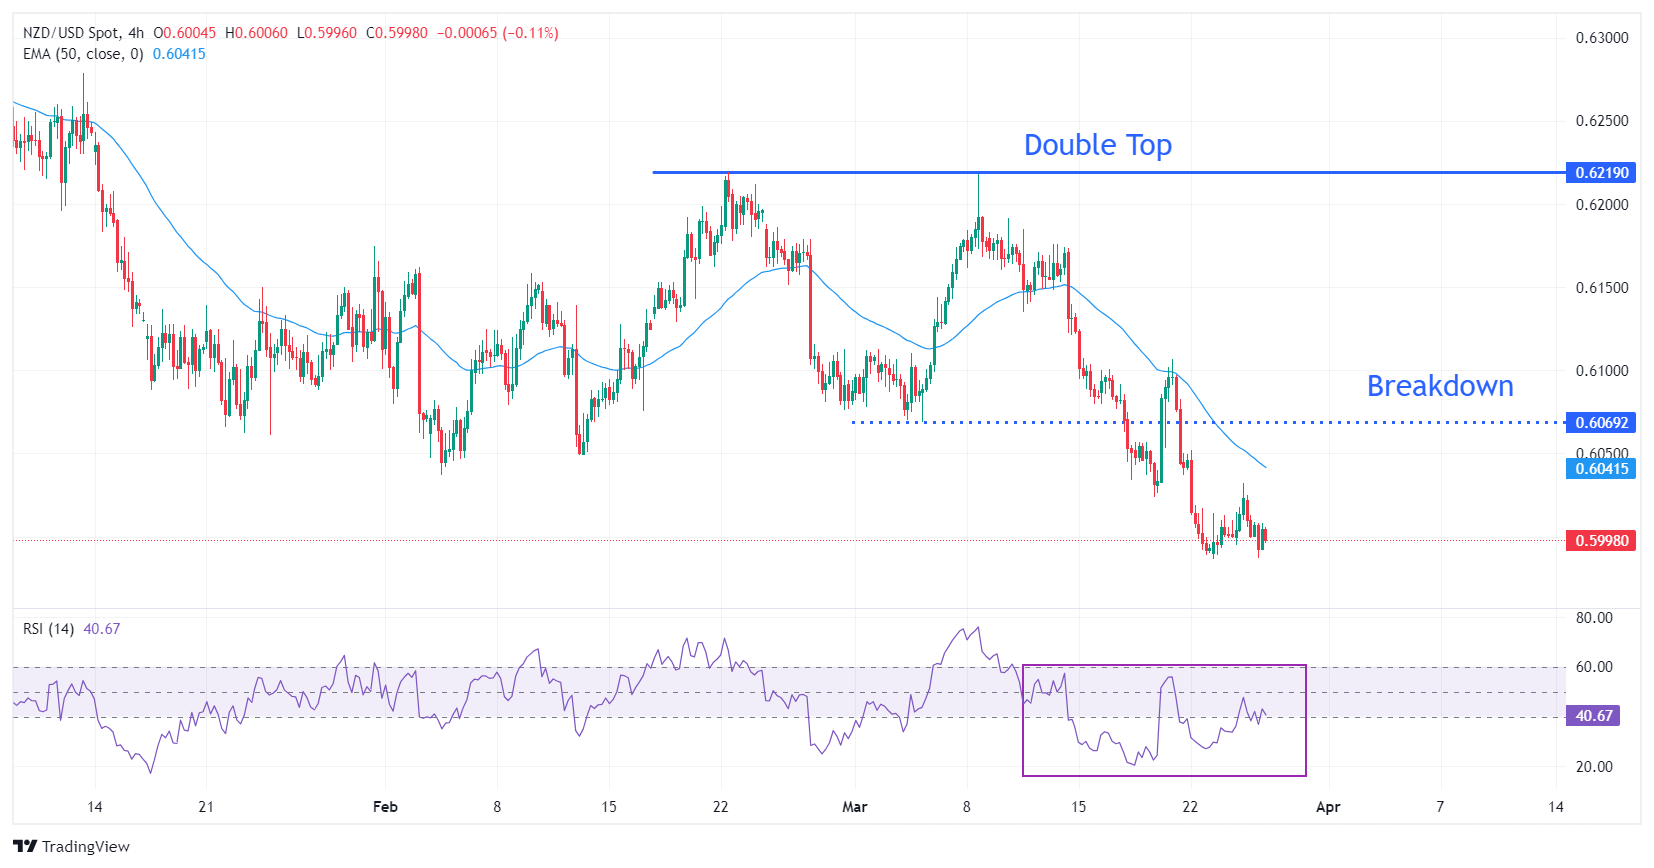
NZD/USD experienced a sharp decline after breaking below the Double Top chart formation near 0.6069 in a four-hour timeframe. The pair tests support below the psychological level of 0.6000, with the 50-period Exponential Moving Average (EMA) near 0.6040, posing a significant barrier for Kiwi bulls.
The 14-period Relative Strength Index (RSI) hovers in the bearish range of 20.00-60.000, indicating potential for further downside. Investors may consider opening short positions when the RSI witnesses a pullback to 60.00.
A breach below the intraday low of 0.5987 could lead to more downside, targeting the November 17 low at 0.5940 and the round-level support of 0.5900.
Alternatively, a recovery above the March 6 low at 0.6069 may drive the pair towards the March 18 high at 0.6100, followed by the March 12 low at 0.6135.
NZD/USD four-hour chart
NZD/USD
| OVERVIEW | |
|---|---|
| Today last price | 0.6004 |
| Today Daily Change | 0.0000 |
| Today Daily Change % | 0.00 |
| Today daily open | 0.6004 |
| TRENDS | |
|---|---|
| Daily SMA20 | 0.6096 |
| Daily SMA50 | 0.6111 |
| Daily SMA100 | 0.6135 |
| Daily SMA200 | 0.6075 |
| LEVELS | |
|---|---|
| Previous Daily High | 0.6032 |
| Previous Daily Low | 0.5995 |
| Previous Weekly High | 0.6107 |
| Previous Weekly Low | 0.5989 |
| Previous Monthly High | 0.6219 |
| Previous Monthly Low | 0.6037 |
| Daily Fibonacci 38.2% | 0.6018 |
| Daily Fibonacci 61.8% | 0.6009 |
| Daily Pivot Point S1 | 0.5989 |
| Daily Pivot Point S2 | 0.5973 |
| Daily Pivot Point S3 | 0.5952 |
| Daily Pivot Point R1 | 0.6026 |
| Daily Pivot Point R2 | 0.6047 |
| Daily Pivot Point R3 | 0.6063 |