E-Mini S&P 500 Futures
In our September 2025 edition of The Cartography Corner, we provided the following analysis of E-Mini S&P 500 Futures.
Support/Resistance:
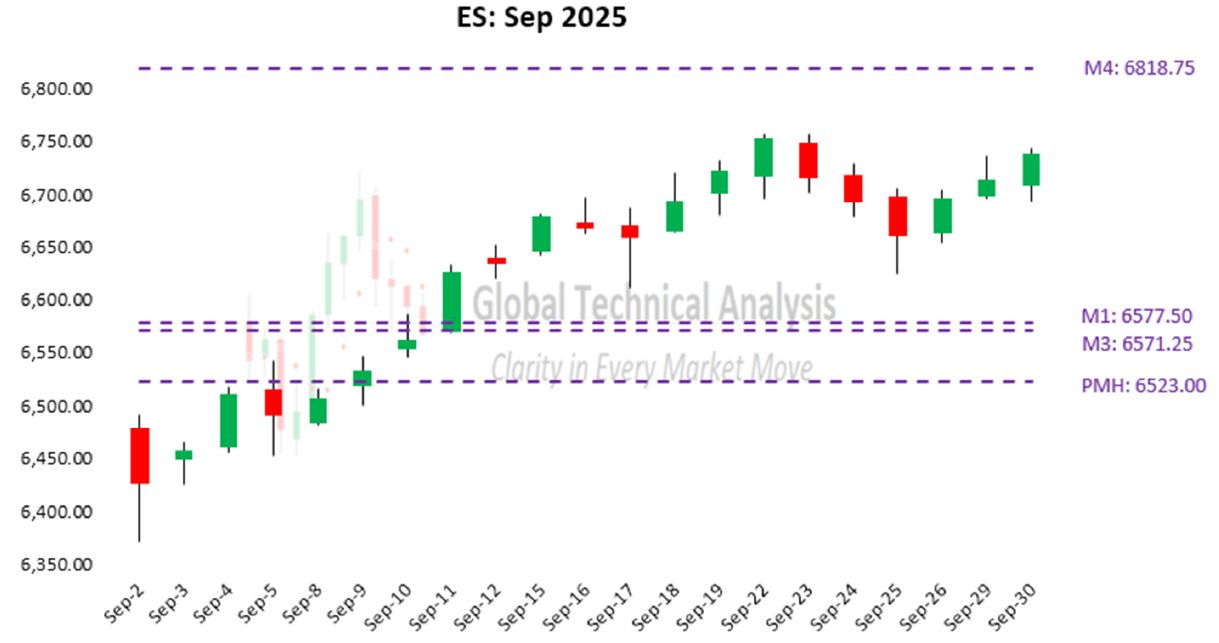
For September, the isolated monthly support and resistance levels are as follows:
- M4: 6818.75.
- M1: 6577.50.
- M3: 6571.25.
- PMH: 6523.00.
- Close: 6472.75.
- MTrend: 6299.11.
- M2: 6251.75.
- PML: 6239.50.
- M5: 6010.50.
Active traders can use M1: 6577.50 as the pivot. Traders should maintain a long position above this level and adopt a flat or short position below it.
Figure 1 presents a candlestick chart illustrating daily price movements throughout September 2025. Support and resistance levels, identified using our methodology, are indicated by dashed lines. The market established the intra-month low at 6371.75 on September 2, remaining above the isolated support level at PML: 6239.50. Over the subsequent six trading sessions through September 10, the market advanced to, and briefly exceeded, the isolated pivot level at M1: 6577.50 but did not settle above it.
From September 11 to 15, the market continued to advance, settling above M1: 6577.50. Over the following two sessions, the market declined by 0.3%, before advancing again over three sessions to the intra-month high at 6756.75 on September 22. The market then declined by 1.4% through September 25, followed by a 1.2% advance over the final three trading sessions.
Figure 1:
High-grade Copper futures
In our September 2025 edition of The Cartography Corner, we provided the following analysis of High-Grade Copper Futures:
Support/Resistance:
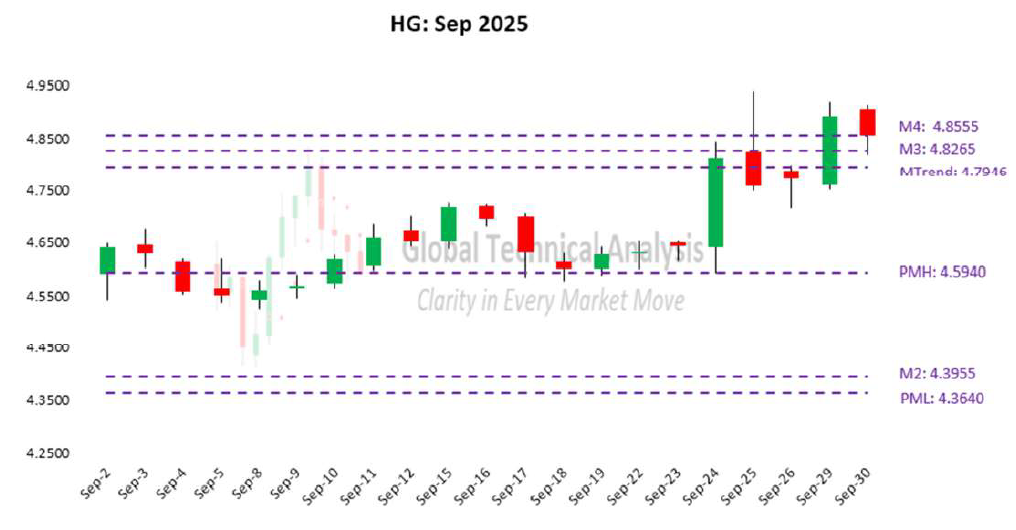
For September, the isolated monthly support and resistance levels are as follows:
- M4: 4.8555
- M3: 4.8265
- MTrend: 4.7946
- PMH: 4.5940
- Close: 4.5905
- M2: 4.3955
- PML: 4.3640• M1: 3.2295
- M5: 2.7695
Active traders can use PMH: 4.5940 as the pivot. Traders should maintain a long position above this level and adopt a flat or short position below it.
Figure 2 presents a candlestick chart illustrating daily price movements throughout September 2025. Support and resistance levels, identified through our methodology, are marked by dashed lines. The market opened the month near the previous month’s high at PMH: 4.5940, exceeding it on September 2 with a high of 4.6490. Over the subsequent four sessions through September 8, prices declined, establishing the intra-month low at 4.5255 while remaining above clustered support at M2: 4.3955 / PML: 4.3640.
From September 9 onward, the market advanced. This ascent culminated on September 25, with the market trading above clustered resistance levels at MTrend: 4.7946 / M3: 4.8265 / M4: 4.8555. The intra-month high was established at 4.9395. With the trade above M4, we now anticipate a two-month low over the next four to six months.
In the final three sessions through September 30, prices declined by 1.7% from the intra-month high, settling at 4.8565.
Figure 2:
E-Mini S&P 500 Futures
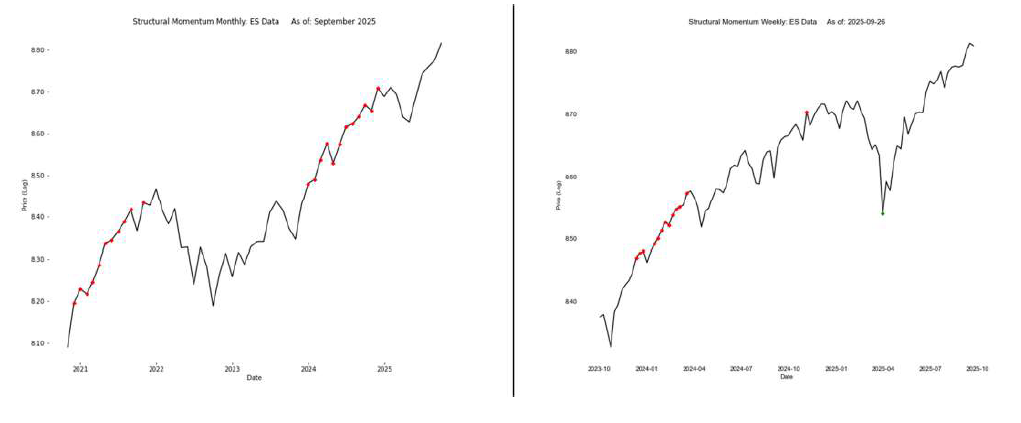
We begin by providing a monthly analysis of E-Mini S&P 500 Futures. This analysis can be conducted for any period or aggregated across multiple timeframes.
Trends:
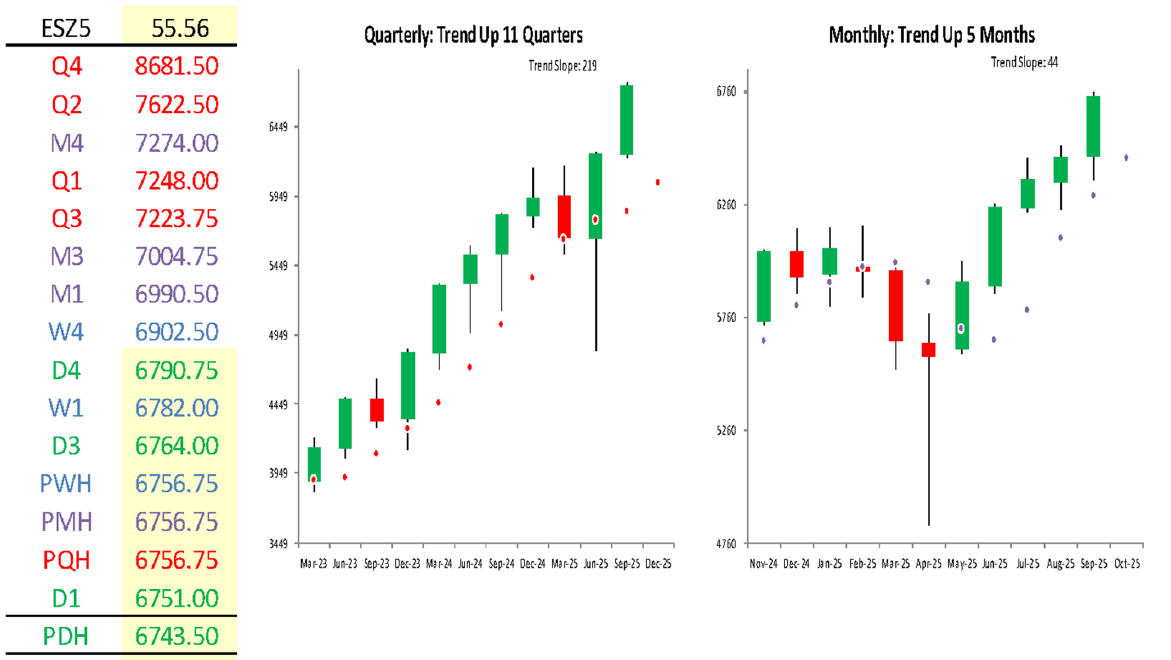
- Current Settlement: 6738.75.
- Daily Trend: 6708.28.
- Weekly Trend: 6656.42.
- Monthly Trend: 6463.61.
- Quarterly Trend: 6047.02.
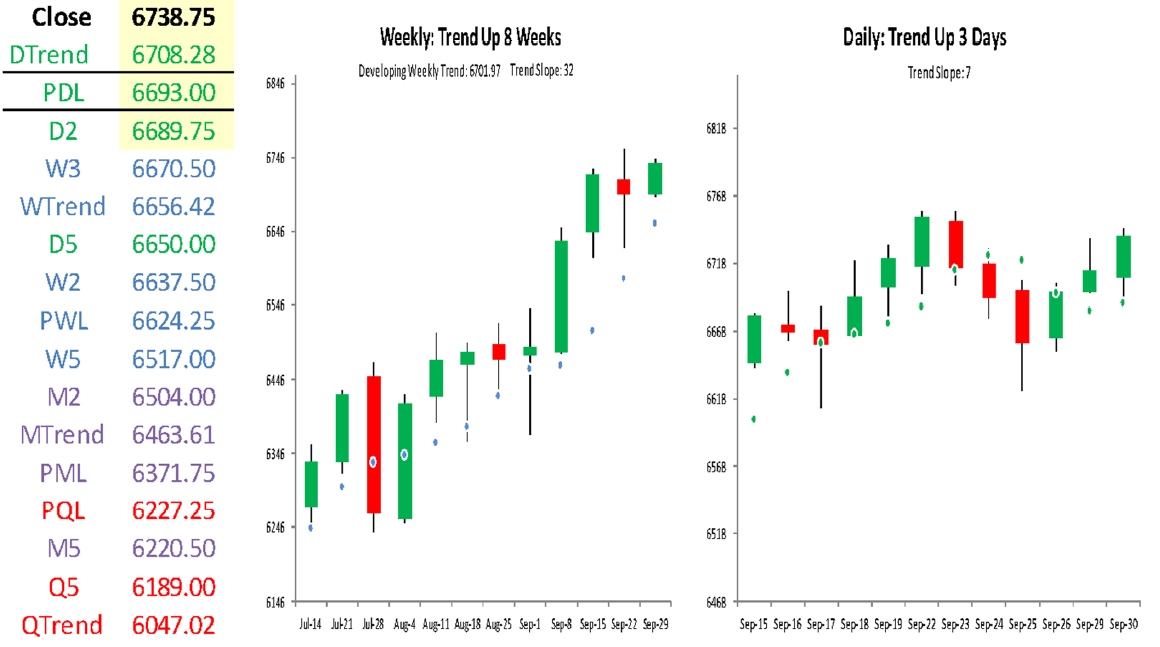
The relative positioning of the Trend Levels indicates a bull market. The quarterly chart shows E-Mini S&P 500 Futures trending upward for eleven quarters. On the monthly chart, the market price settled above Monthly Trend for the fifth consecutive month. On the weekly chart, the market price has been trending upward for eight weeks.
Momentum
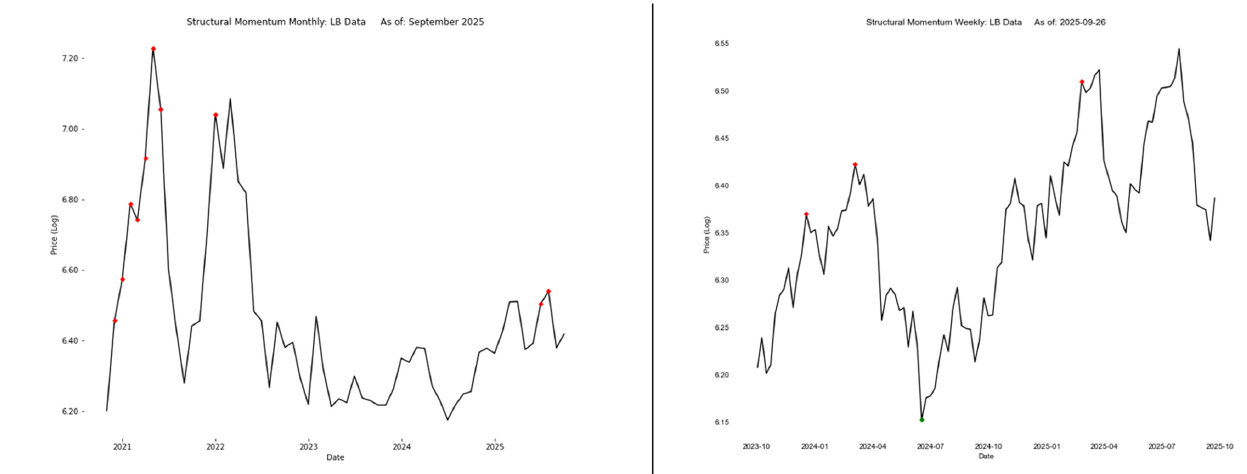
This metric evaluates the market price’s deviation from its average trading point over a specified period. Monthly Momentum is currently neutral. Weekly Momentum is also neutral. For a detailed visual analysis, refer to Figure 3.
Figure 3:
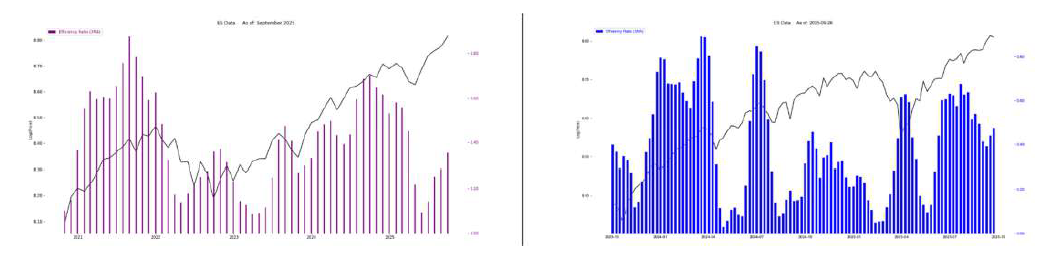
Efficiency Ratio (ER):
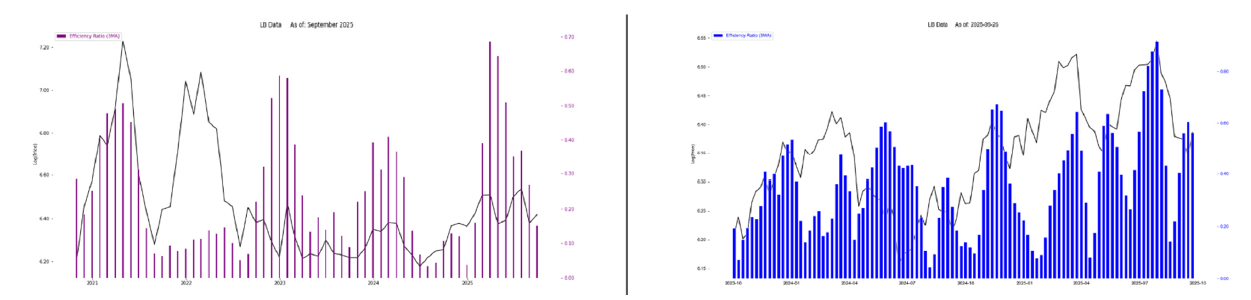
This metric gauges the ‘noise’ of market prices. A low ER reflects higher noise and a lack of trending behavior, while a high ER signals stronger trends. The Monthly Efficiency Ratio indicates that the rebound from the April low continues to gain strength. The Weekly Efficiency Ratio also indicates that the recent bullish trend is strengthening. For a detailed visual analysis, refer to Figure 4.
Figure 4:
Market reversals and signals
We identify exhaustion levels to anticipate market reversals. A key principle involves anticipating a two-period high or low (e.g., weeks, months, or quarters) within four to six subsequent periods of the same timeframe after reaching the Downside or Upside Exhaustion level. In 2Q 2025, a signal was identified suggesting a two quarter high within the next four to six quarters. This high was realized in 3Q 2025 with the trade above 6265.50.
Support/Resistance
For October, the isolated monthly support and resistance levels are as follows:
- M4: 7274.00
- M3: 7004.75
- M1: 6990.50
- PMH: 6756.75
- Close: 6738.75
- M2: 6504.00
- MTrend: 6463.61
- PML: 6371.75
- M5: 6220.50
Active traders can use PMH: 6756.75 as the pivot. Traders should maintain a long position above this level and adopt a flat or short position below it.
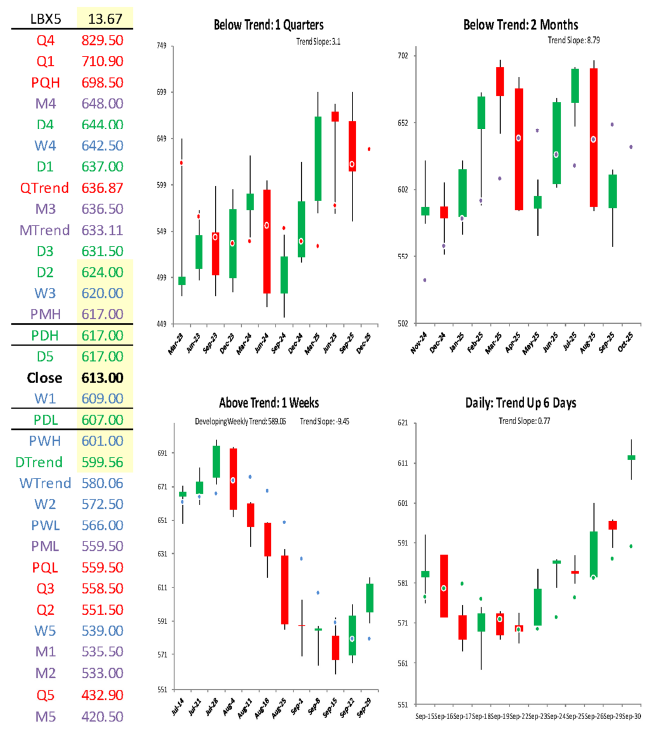
Lumber futures
For October, our focus will be on Lumber Futures. This analysis can be conducted for any period or aggregated across multiple timeframes.
Trends
- Quarterly Trend: 636.87.
- Monthly Trend: 633.11.
- Current Settlement: 613.00.
- Daily Trend: 599.56.
- Weekly Trend: 580.06.
The Trend Levels’ relative positioning signals a rebound within a bear market. The quarterly chart shows that Lumber has settled below Quarterly Trend for one quarter. On the monthly chart, the market price has settled below Monthly Trend for two months. On the weekly chart, Lumber settled above Weekly Trend for the first time in eight weeks.
Momentum
This metric evaluates the market price’s deviation from its average trading point over a specified period. Monthly Momentum is currently neutral. Weekly Momentum is also neutral. For a detailed visual analysis, refer to Figure 5.
Figure 5:
Efficiency ratio (ER):
This metric gauges the ‘noise’ of market prices. A low ER reflects higher noise and a lack of trending behavior, while a high ER signals stronger trends. The Monthly Efficiency Ratio confirms the noise observed in the range bound trade from April. The Weekly Efficiency Ratio indicates that the recent bearish trend is strengthening. For a detailed visual analysis, refer to Figure 6.
Figure 6:
Market reversals and signals
We identify exhaustion levels to anticipate market reversals. A key principle involves anticipating a two-period high or low (e.g., weeks, months, or quarters) within four to six subsequent periods of the same timeframe after reaching the Downside or Upside Exhaustion level. In August 2025, a signal was identified suggesting a two-month high within the next four to six months (now, three to five months). This high can be realized in October 2025 with a trade above 698.50.
Support/resistance:
For October, the isolated monthly support and resistance levels are as follows:
- M4: 648.00.
- M3: 636.50.
- MTrend: 633.11.
- PMH: 617.00.
- Close: 613.00.
- PML: 559.50.
- M1: 535.50.
- M2: 533.00.
- M5: 420.50.
Active traders can use PMH: 617.00 as the pivot. Traders should maintain a long position above this level and adopt a flat or short position below it.
Trend model
As of September 30, 2025:
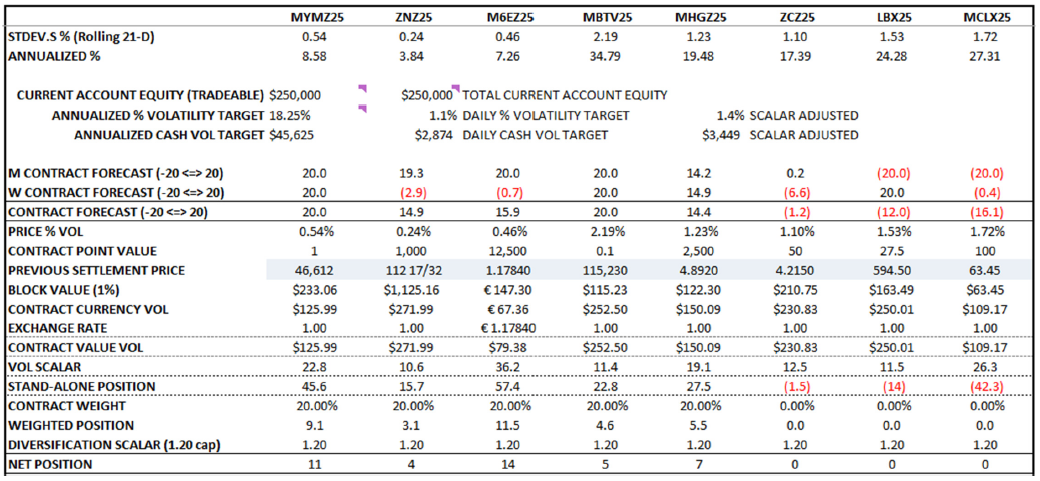
The amounts and positions shown are for demonstration and educational purposes only and do not represent actual figures.