- Silver meets with a fresh supply on Monday and drifts back closer to a multi-week low.
- The technical setup favours bearish traders and supports prospects for deeper losses.
- A sustained move beyond the $23.50 confluence is needed to negate the negative bias.
Silver (XAG/USD) extends Friday’s retracement slide from the mid-$23.00s and continues losing ground through the early part of the European session on the first day of a new week. The white metal currently trades just below the $23.00 round figure and remains well within the striking distance of a three-week trough touched last Thursday.
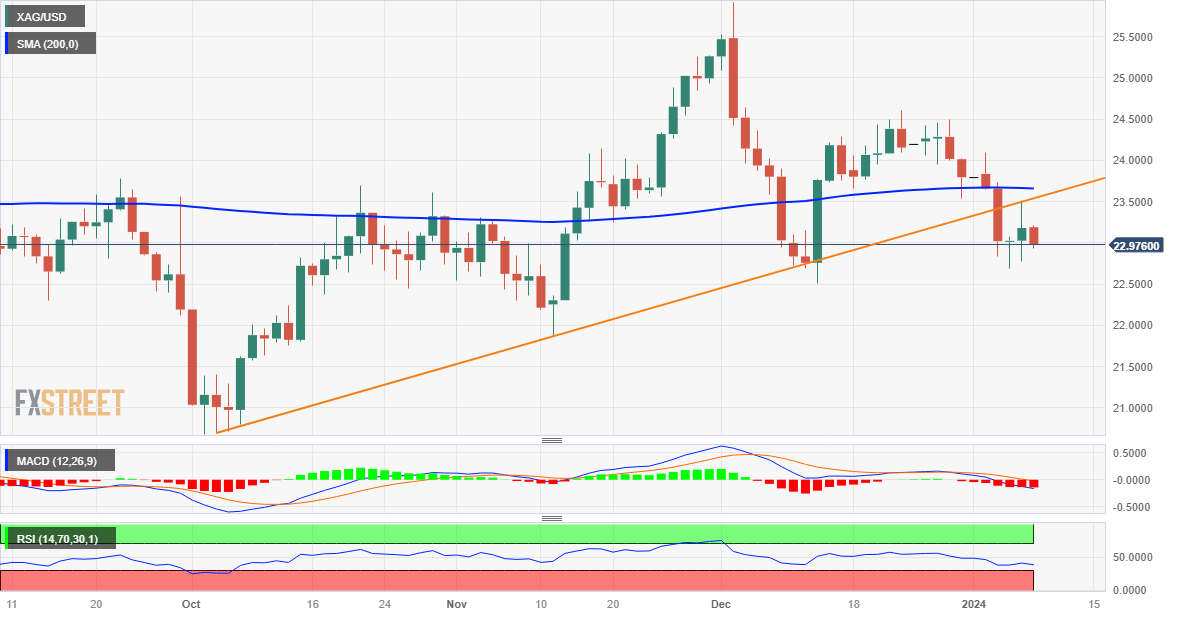
From a technical perspective, last week’s sustained breakdown and a subsequent failure near the very important 200-day Simple Moving Average (SMA) favours bearish traders. Moreover, oscillators on the daily chart are holding in the negative territory and are still far from being in the oversold zone. This, in turn, suggests that the path of least resistance for the XAG/USD is to the downside and supports prospects for an extension of the recent downtrend witnessed over the past week or so.
That said, it will still be prudent to wait for some follow-through selling below the multi-week trough, around the $22.70 region, before positioning for any further losses. The XAG/USD might then accelerate the fall further towards the December monthly swing low, around the mid-$22.00s, en route to the next relevant support near the $22.25 region. The downward trajectory could get extended and drag the white metal towards testing sub-$22.00 levels, or the November monthly swing low.
On the flip side, any meaningful recovery attempt might continue to confront resistance near the $23.50 confluence, comprising the 200-day SMA and a multi-month-old ascending trend-line support breakpoint. A sustained strength beyond might trigger a short-covering rally and lift the XAG/USD to the $24.00 mark, with some intermediate hurdle near the $23.80 region. Some follow-through buying will suggest that the recent corrective decline from the $24.60 region has run its course.
Silver daily chart
Technical levels to watch
XAG/USD
| OVERVIEW | |
|---|---|
| Today last price | 22.94 |
| Today Daily Change | -0.24 |
| Today Daily Change % | -1.04 |
| Today daily open | 23.18 |
| TRENDS | |
|---|---|
| Daily SMA20 | 23.75 |
| Daily SMA50 | 23.66 |
| Daily SMA100 | 23.32 |
| Daily SMA200 | 23.66 |
| LEVELS | |
|---|---|
| Previous Daily High | 23.52 |
| Previous Daily Low | 22.78 |
| Previous Weekly High | 24.09 |
| Previous Weekly Low | 22.69 |
| Previous Monthly High | 25.92 |
| Previous Monthly Low | 22.51 |
| Daily Fibonacci 38.2% | 23.23 |
| Daily Fibonacci 61.8% | 23.06 |
| Daily Pivot Point S1 | 22.8 |
| Daily Pivot Point S2 | 22.42 |
| Daily Pivot Point S3 | 22.06 |
| Daily Pivot Point R1 | 23.54 |
| Daily Pivot Point R2 | 23.9 |
| Daily Pivot Point R3 | 24.28 |