- USD/JPY stuck to 141.00 as markets head towards 2024.
- Greenback shed a third of a percent against the Yen on the last Friday of 2023.
- USD/JPY down a full percent on the week, but up 7% on the year.
The USD/JPY is back into the 141.00 handle as the pair struggles to accelerate momentum in either direction as markets wind up the 2023 trading year.
Post-holiday markets saw a thin week ahead of the New Year’s long weekend, and the US Dollar (USD) is down 0.3% against the Japanese Yen (JPY) for the last Friday of the trading year, shedding a full percentage point on the week.
US economic data continues to miss the mark with the US Chicago Purchasing Managers’ Index (PMI) printing below expectations on Friday, coming into at a contractionary 46.9 in December compared to November’s 18-month peak of 55.8, coming in well below the median market forecast of 51.0.
Steepening misses in US data figures are counter-intuitively supportive of broad-market risk appetite, with investors expecting souring economic outlooks across the globe helping to push the Federal Reserve (Fed) towards a faster pace of rate cuts in 2024.
USD/JPY Technical Outlook
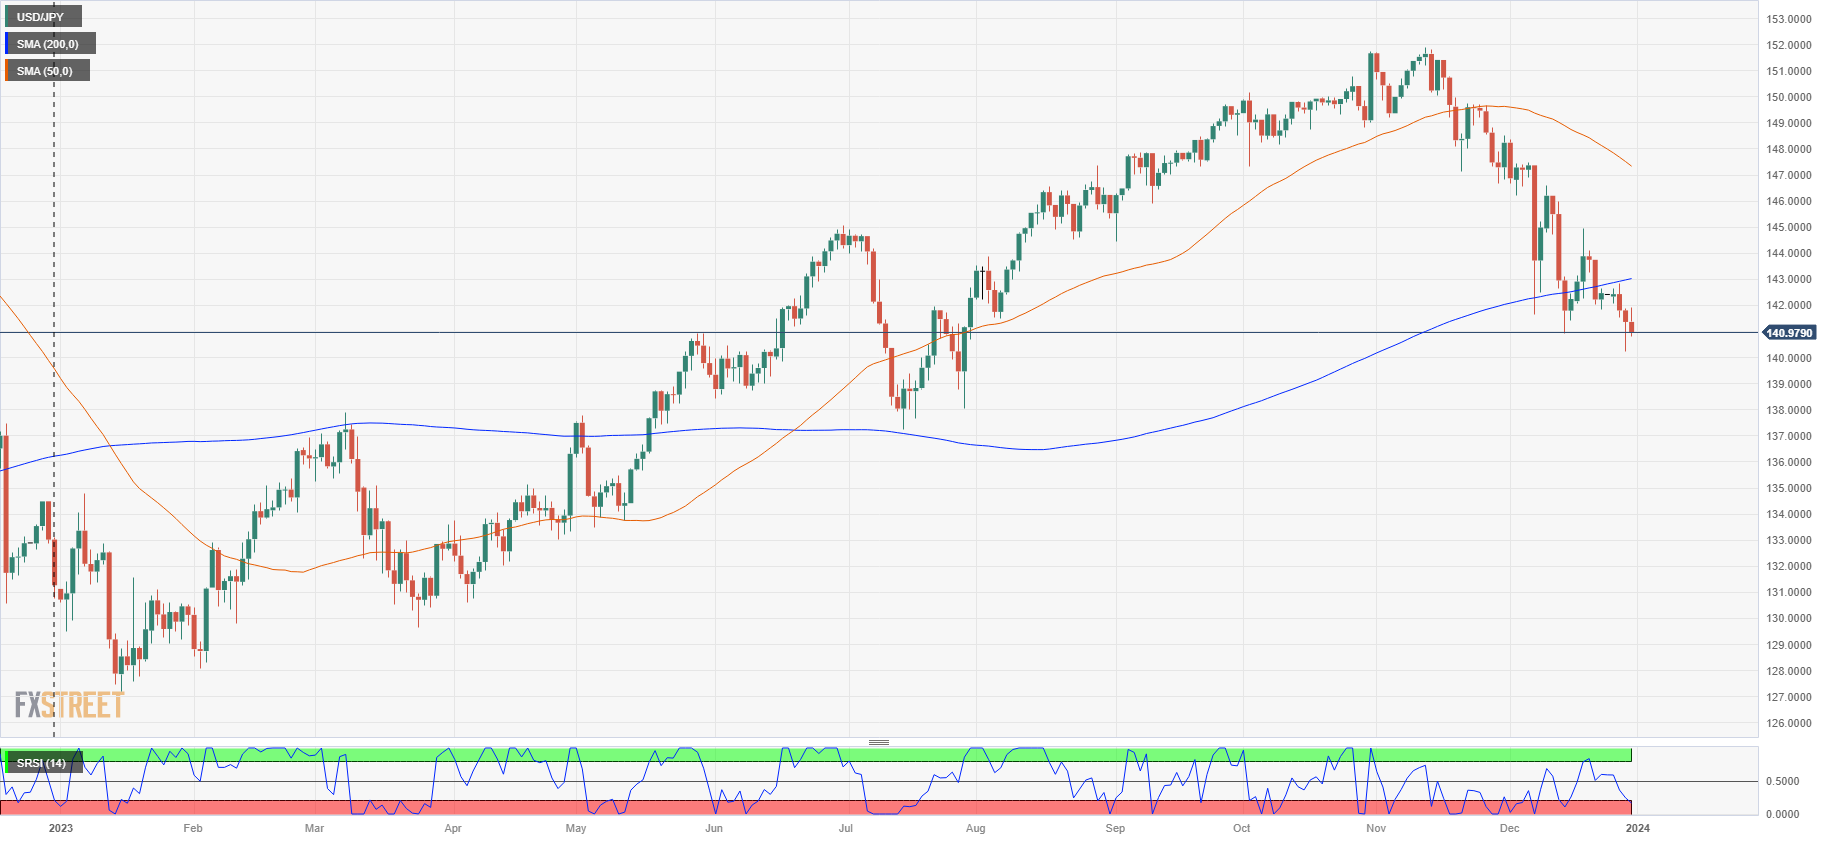
With the USD/JPY up around 7% on the year compared to being in the red for December, the last few trading weeks of 2023 have been particularly Dollar-negative, and there is little technical reason for the trend to reverse direction heading into 2024.
The pair etched in a yearly high of 151.91 in November, coming within inches of October 2022’s peak bids of 151.94 before slumping back toward the 140.00 major handle.
The USD/JPY has closed in the red for all but one of the last seven consecutive trading weeks, and the pair is extending a push into bear country on the south end of the 200-day Simple Moving Average (SMA) near 143.00.
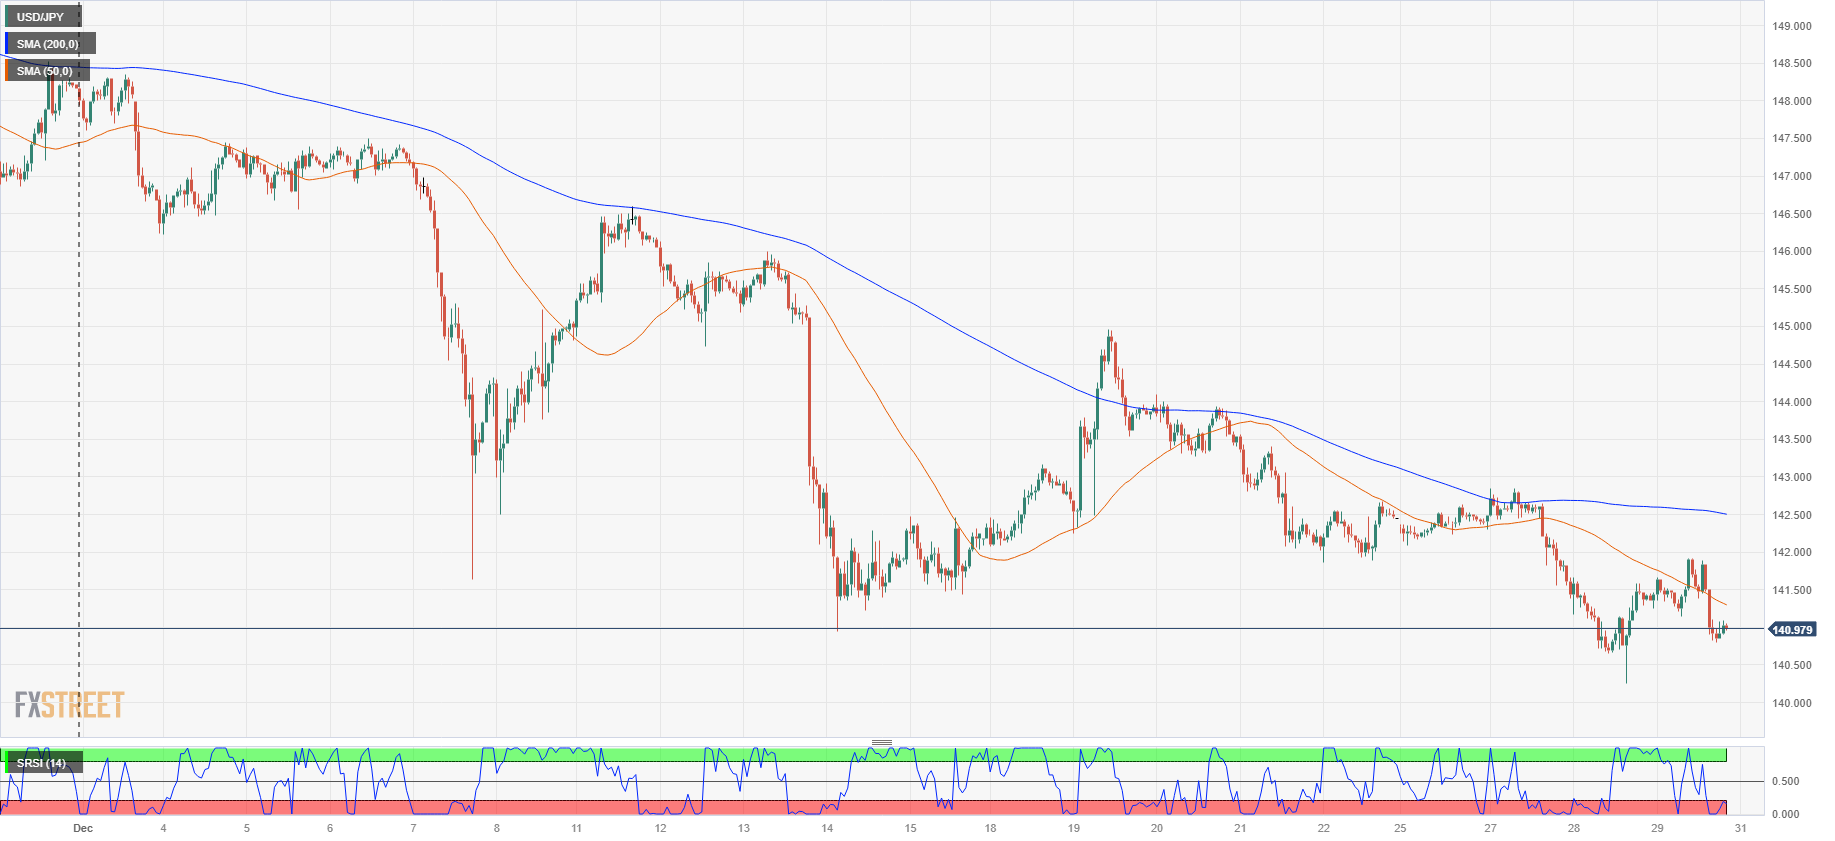
USD/JPY Hourly Chart
USD/JPY Daily Chart
USD/JPY Technical Levels
USD/JPY
| OVERVIEW | |
|---|---|
| Today last price | 140.98 |
| Today Daily Change | -0.39 |
| Today Daily Change % | -0.28 |
| Today daily open | 141.37 |
| TRENDS | |
|---|---|
| Daily SMA20 | 143.97 |
| Daily SMA50 | 147.52 |
| Daily SMA100 | 147.59 |
| Daily SMA200 | 142.98 |
| LEVELS | |
|---|---|
| Previous Daily High | 141.89 |
| Previous Daily Low | 140.25 |
| Previous Weekly High | 144.96 |
| Previous Weekly Low | 141.86 |
| Previous Monthly High | 151.91 |
| Previous Monthly Low | 146.67 |
| Daily Fibonacci 38.2% | 140.88 |
| Daily Fibonacci 61.8% | 141.26 |
| Daily Pivot Point S1 | 140.45 |
| Daily Pivot Point S2 | 139.53 |
| Daily Pivot Point S3 | 138.81 |
| Daily Pivot Point R1 | 142.09 |
| Daily Pivot Point R2 | 142.81 |
| Daily Pivot Point R3 | 143.73 |